
Neuchâtel Observatory Trial Database in Pictures
A treasure trove of data from Neuchâtel now visualised

The Observatory Trials at Neuchâtel are the stuff of legend. I have always wondered how to find a way to bring this data to life by parsing it, tabling and graphing it.
Inside you will find the facts of how the brands traded places, who entered how many pieces, how the spread of performance of the entrants varied amongst the top players, who were the best régleurs in the competition and we look at the trends in the more than 600 watches Girard-Perregaux chose to enter in 1967.
Some examples of the analysis below. I’ve made this mostly visual and low on context and exposition. if there is a question in your mind about the data, please ask and I will try to produce a graph to answer it. I intend to update the plots and table as I think of further things, so please check back into this now and again.
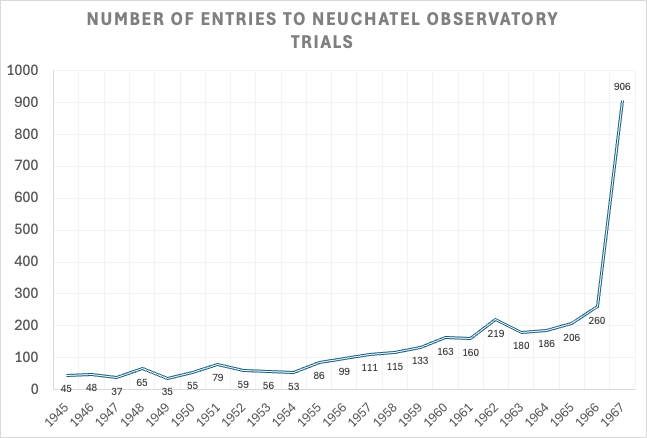
A total of 3356 watches over 22 years.
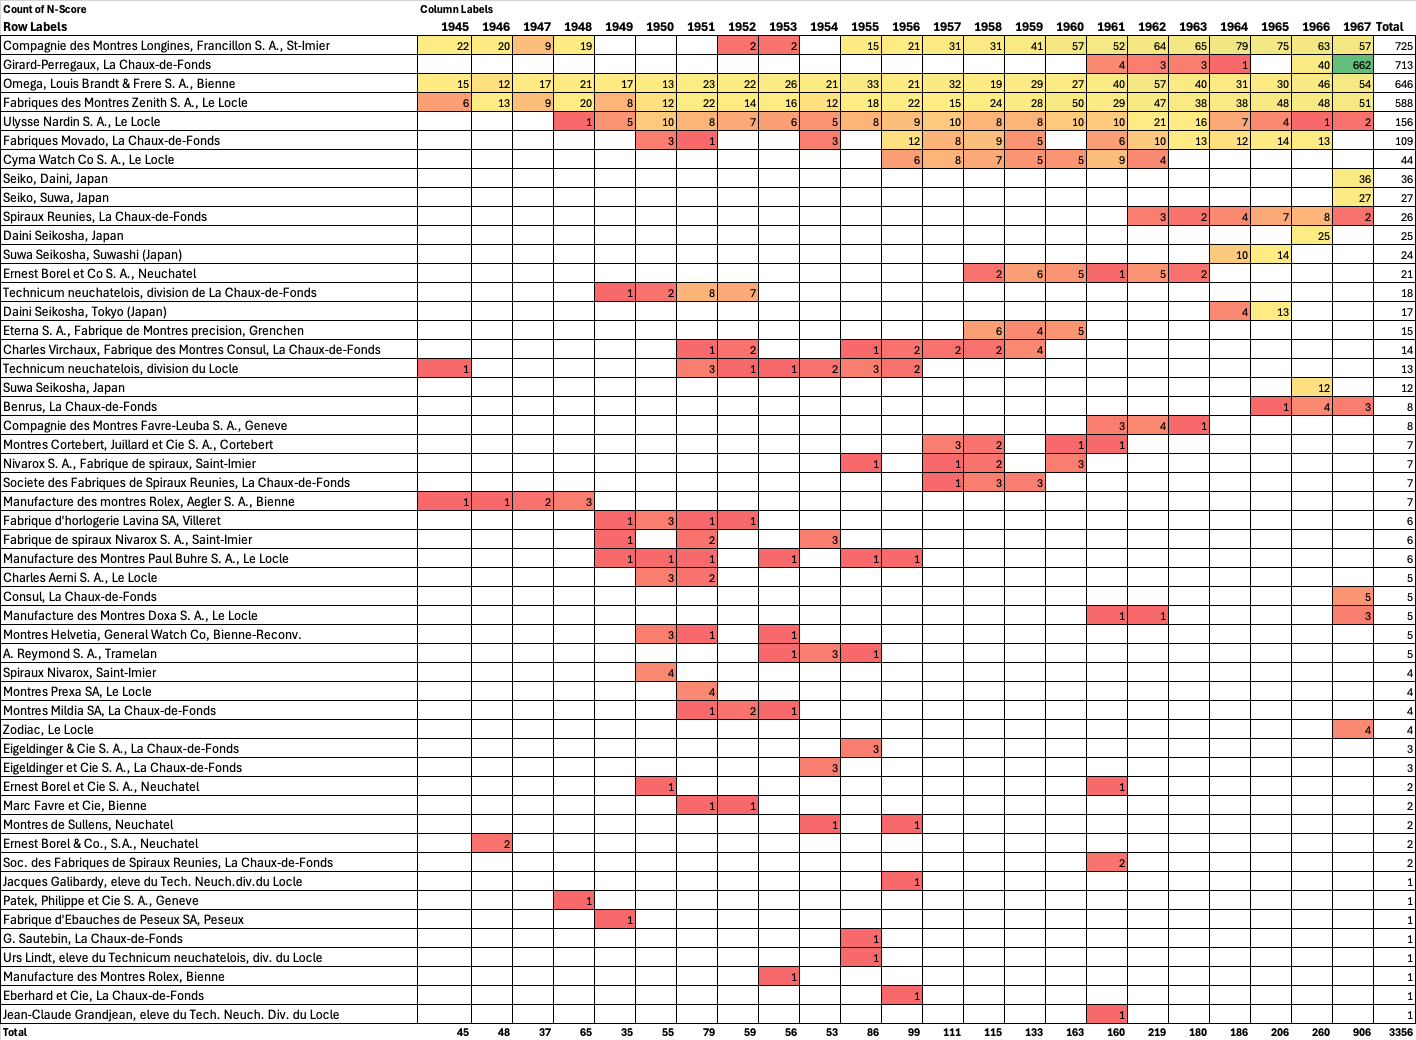
Number of entries by year for each entrant. Note the 662 entries by Girard-Perregaux in 1967
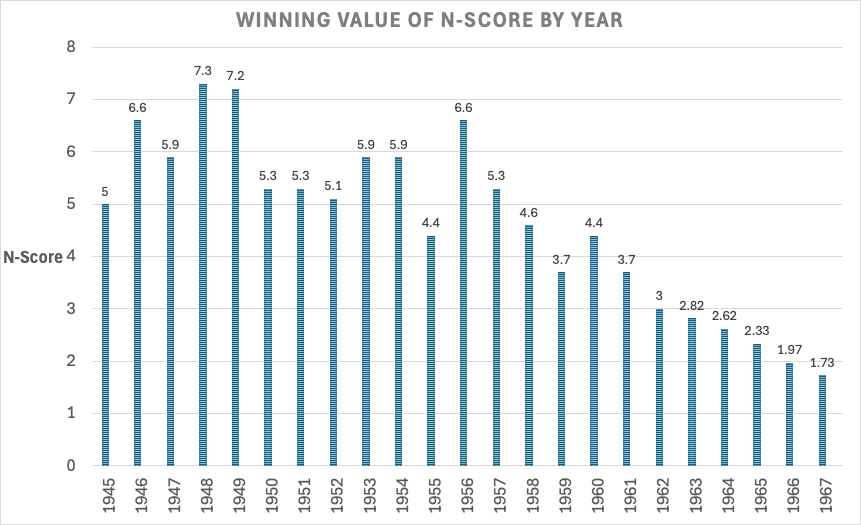
Winning score by year. Longines’ opening result would not be bettered until a decade later.
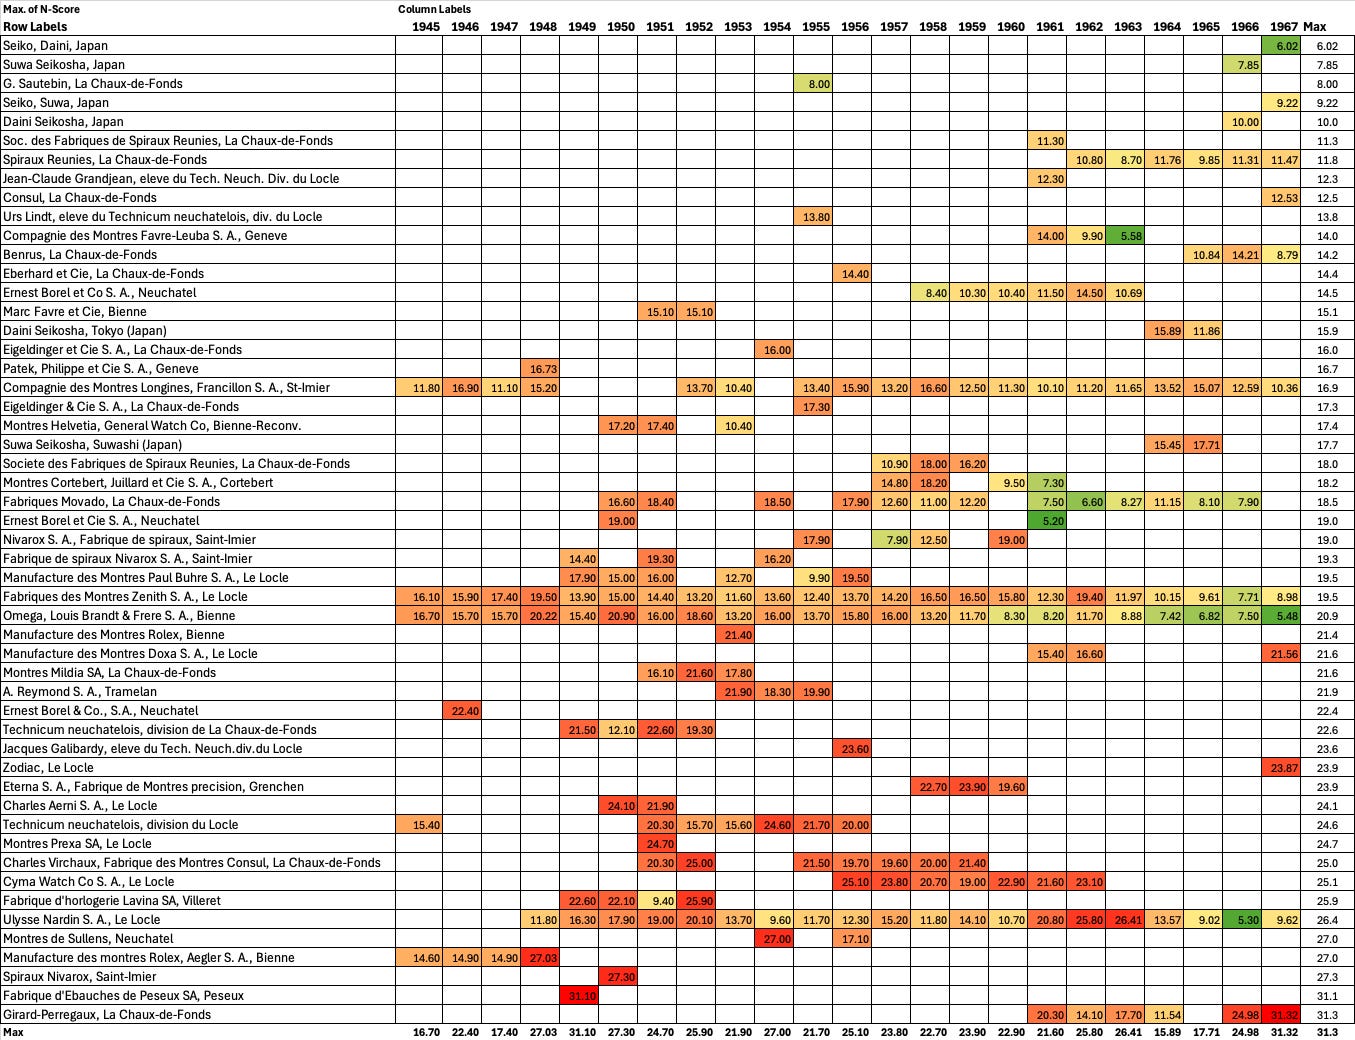
Before we get into the best, here is the worst score for each year for each competing entrant
Now we’ll look at the leadership board for the winners, then dive into minima, and averages. Then the distributions of populations of results by brand: all time and in the crucial last five years; how the medians compared to the best.
And then finally in honour of the people who did it, I have also assembled a leaderboard of the régleurs and make a pick of the GOAT.
Having done the comparison of the modern era CIC trials with COSC, the next study (a future post) will aim to demonstrate what a CIC watch would have likely achieved if submitted in these Neuchâtel trials.